 Joe McCraw

A hands-on debugging lab for iOS developers.
Practice with Xcode and Instruments, investigate the evidence, and understand what changed.
The problem
Most debugging advice is about tools in the abstract. Here’s what a breakpoint is, here’s what the Memory Graph shows you. It reads fine, and then the first time something actually breaks you’re staring at a stack trace trying to remember which tool to reach for.
The solution
SignalLab is an iOS app for practicing debugging and performance investigation. Each lab provides a focused scenario and a repeatable workflow with Xcode or Instruments. Some reproduce a failure and compare broken and fixed implementations; others teach a diagnostic technique, such as following an ownership path in Memory Graph or comparing debugger stop behavior.
I built it for junior and intermediate iOS developers who want more practice with the debugger and Instruments, and for mentors or interview coaches who want concrete exercises instead of slides.
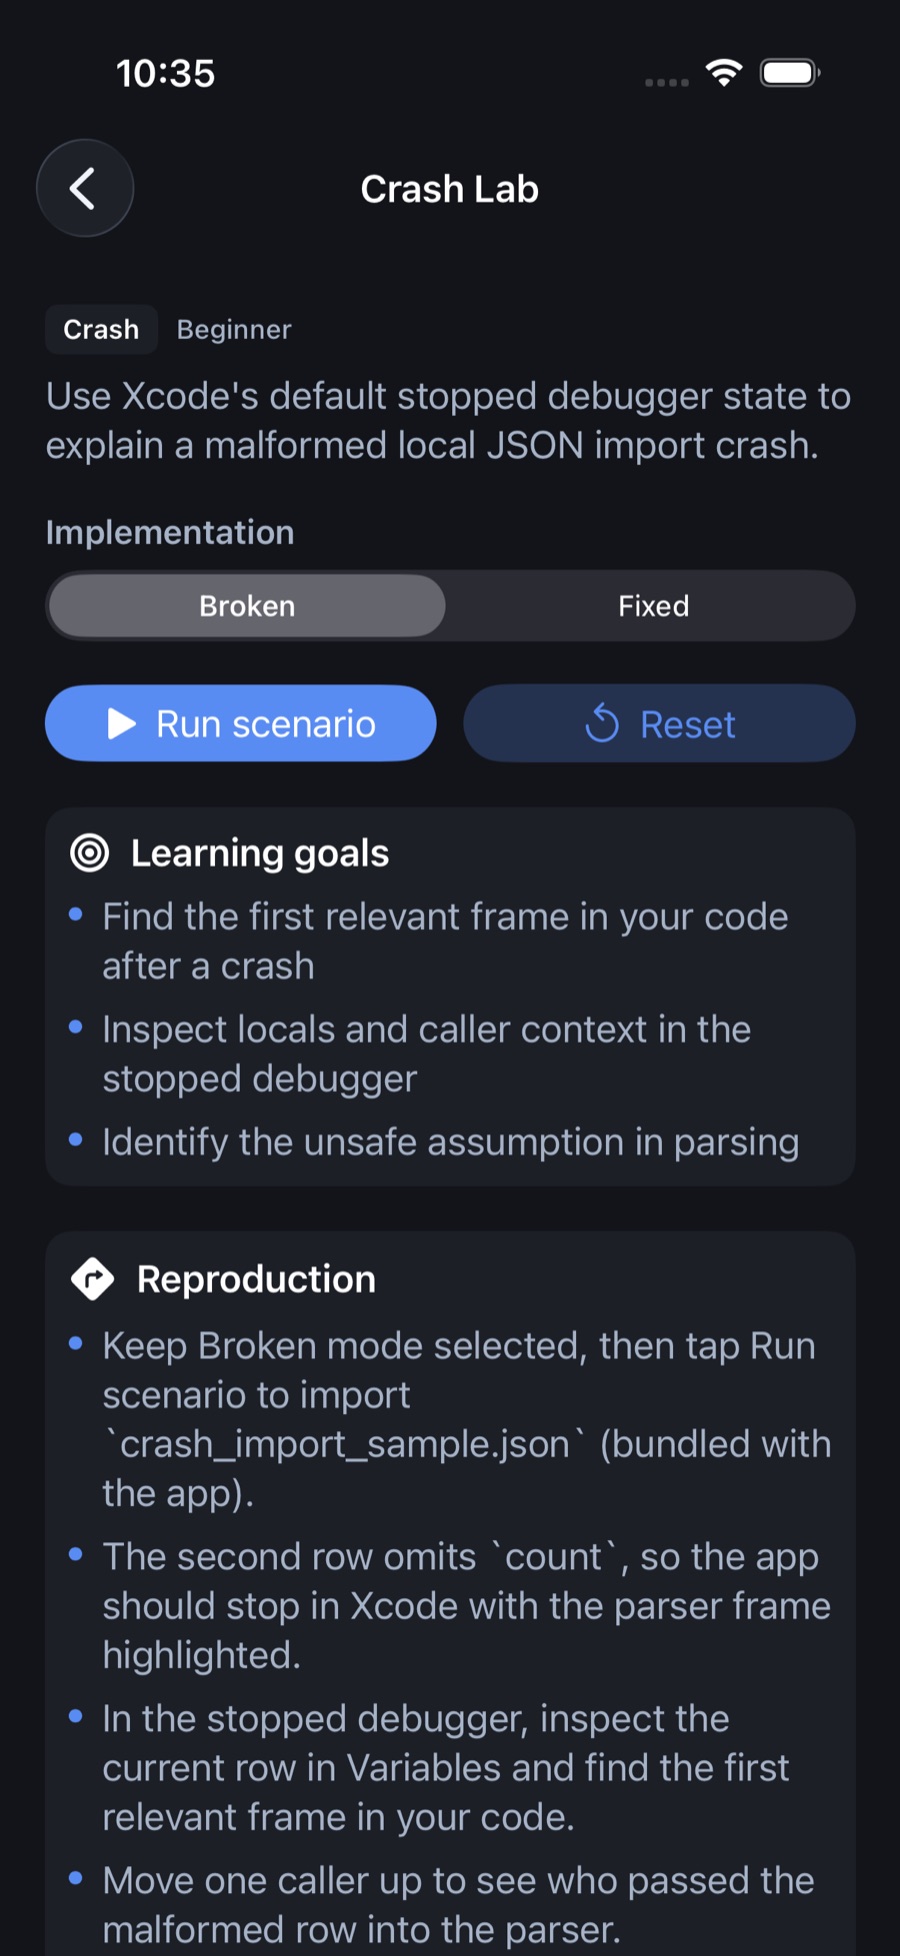
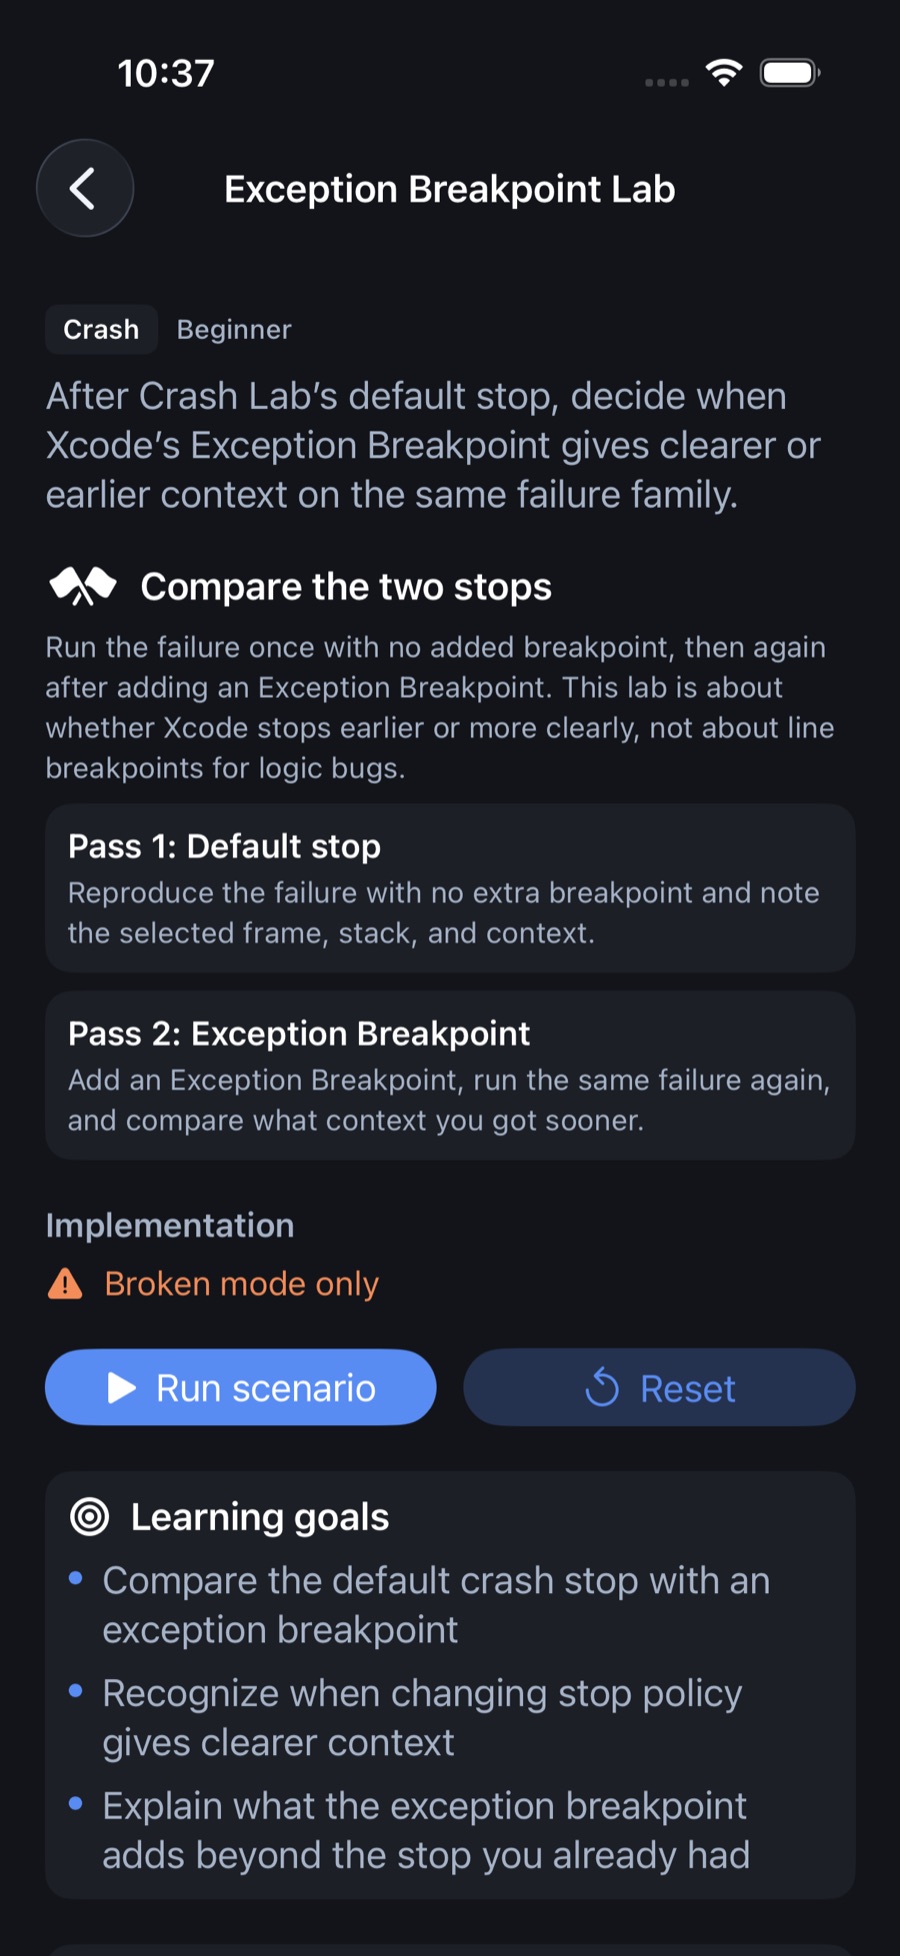
How a lab works
- One lesson per lab. You should always know what the point is.
- A symptom you can see. The app crashes, the UI freezes, a total is wrong, an object won’t go away, a search gets sluggish.
- A fast trigger. If it takes ten minutes to reproduce, nobody learns anything.
- A suggested first tool and some hints. Enough to point you somewhere without handing over the answer.
- A comparison that fits the lesson. Where supported, compare Broken and Fixed modes. Diagnostic labs instead guide you through inspecting evidence or comparing investigation techniques.
The first six
- Crash Lab. A malformed local JSON import crashes the app. Find the first frame that’s yours and the bad assumption behind it.
- Exception Breakpoint Lab. The same kind of failure, but now you compare Xcode’s default stop with what an Exception Breakpoint gives you.
- Breakpoint Lab. An order total is wrong and nothing crashes. A line breakpoint on the discount calculation shows it applying 5% where 20% was expected.
- Memory Graph Lab. Follow one ownership path to see which object is keeping another one alive.
- Hang Lab. Heavy JSON work on the main thread freezes the UI. Pause during the freeze and see what’s actually running.
- CPU Hotspot Lab. A searchable list slows down because every keystroke repeats expensive work. Find it with Time Profiler.
Past those there’s a dozen more in the catalog: Thread Performance Checker, zombies, Thread Sanitizer, retain cycles, heap growth, deadlocks, scroll hitches, startup signposts, and a few others.
Inside the app
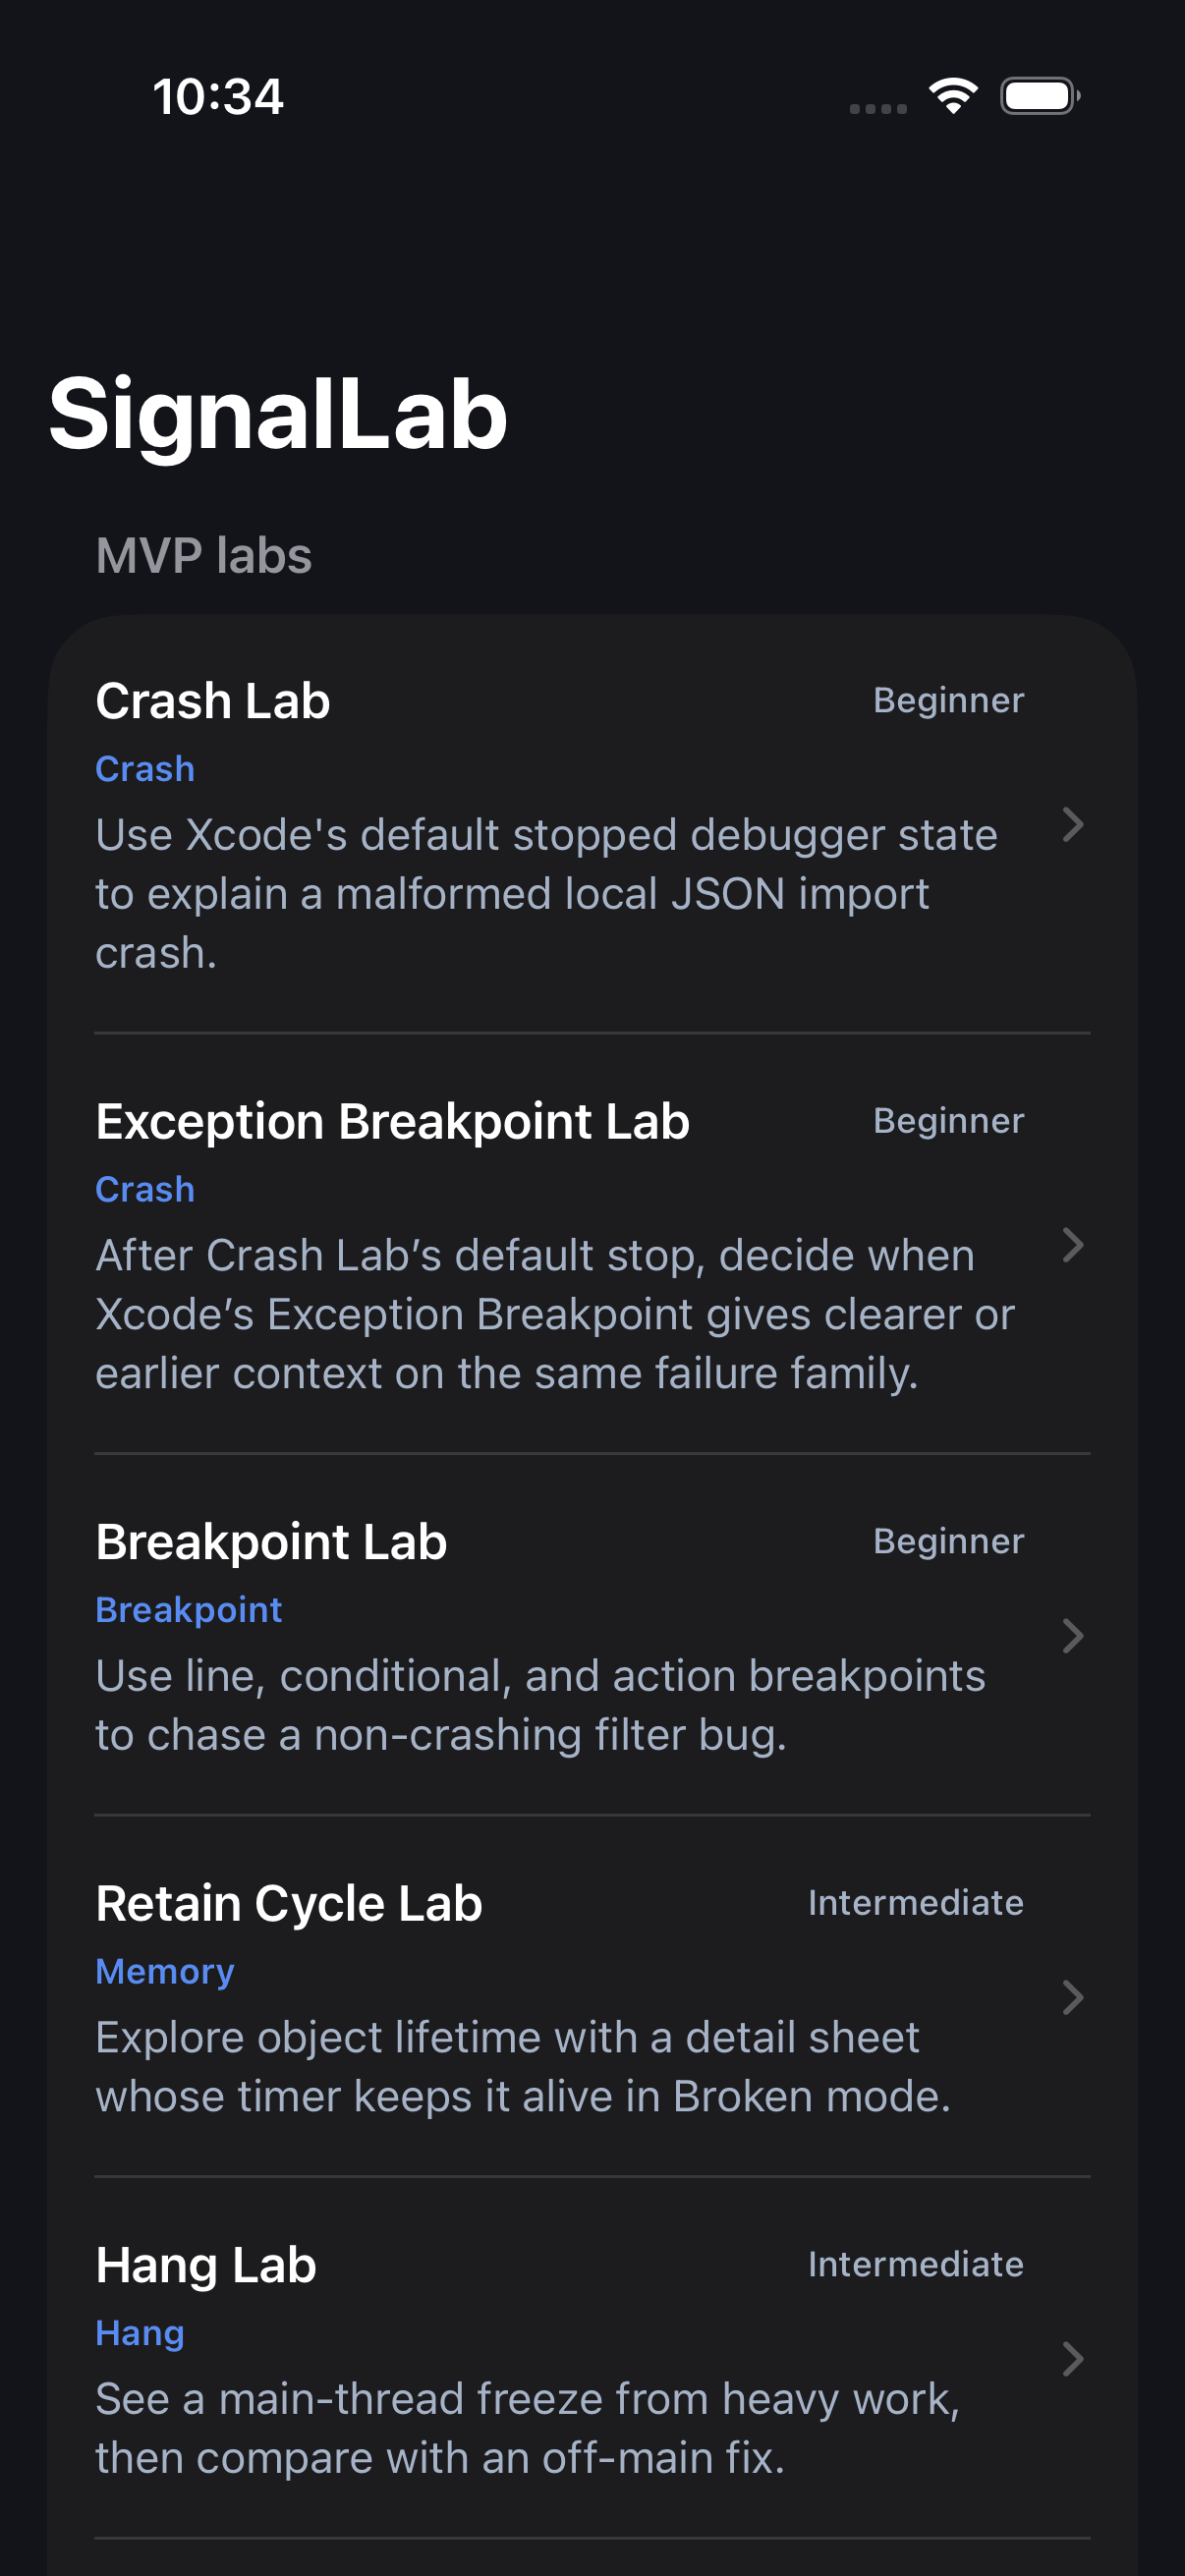
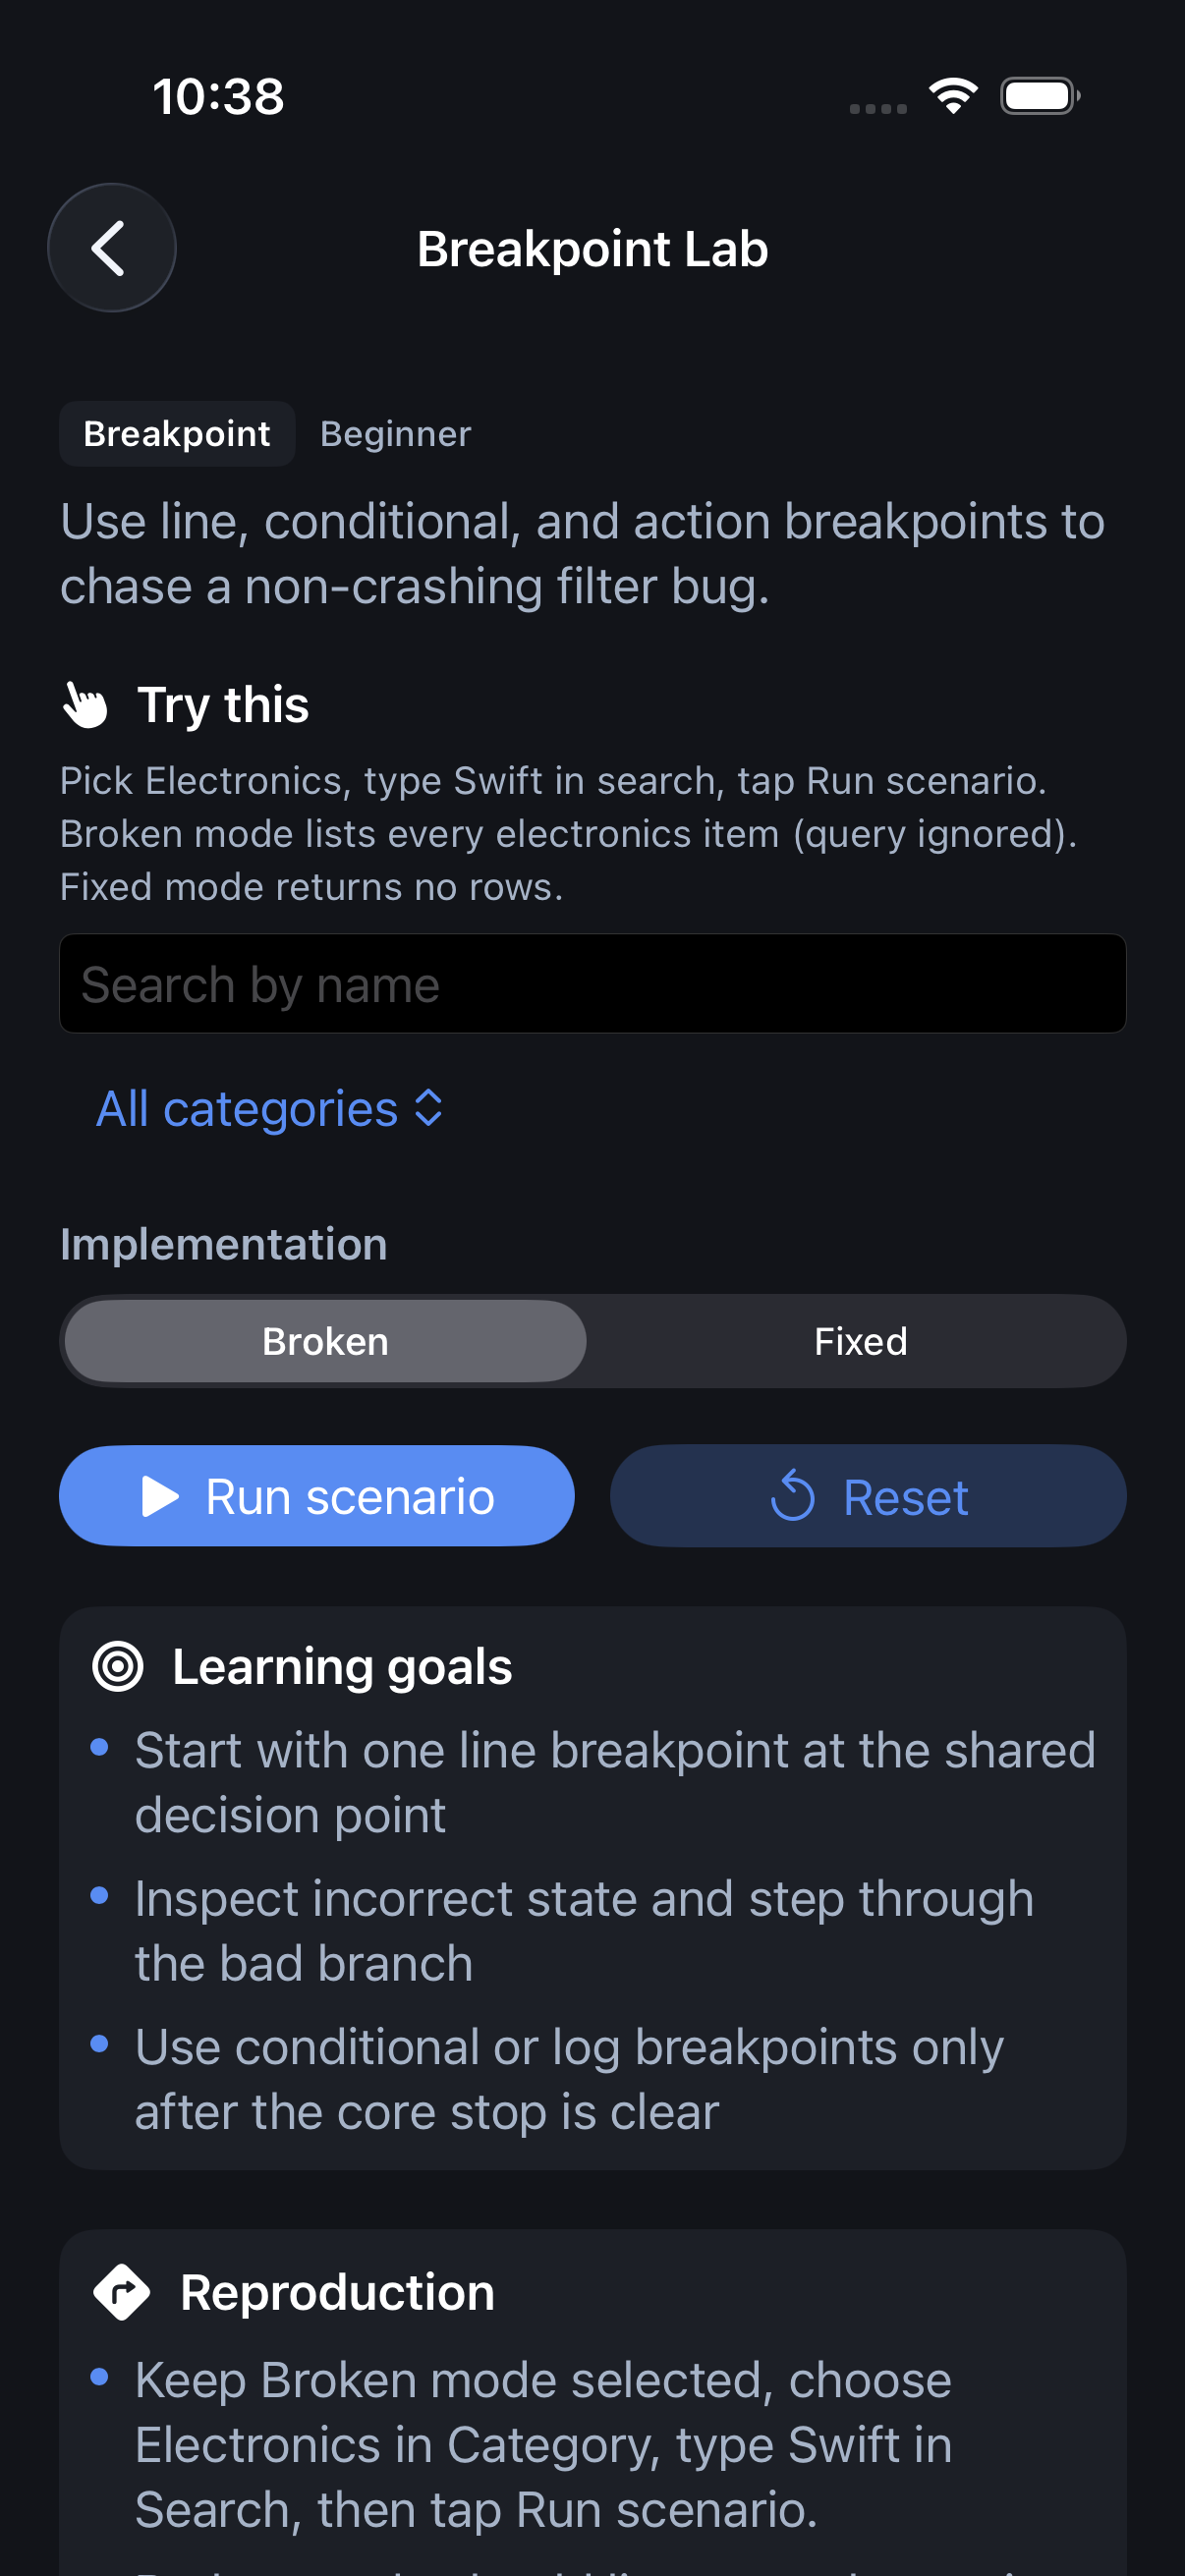
What it isn’t
SignalLab is deliberately not a tour of every Xcode feature, and it’s not a replacement for Apple’s documentation. I’m keeping it small on purpose: clear, reproducible, and strong on one lesson at a time.
I also wanted it to feel like a developer tool rather than a tutorial. It’s dark, calm, and fairly precise, and color is reserved for things that mean something, like warnings, faults, and memory.
Status
Still being built. The first six labs and the extra diagnostics labs are working in the app, and the code is public on GitHub.